
The Cascade That Wasn't: When $644 Million Liquidated in 20 Minutes—and the Market Wasn't Even Close to Critical
The largest crypto liquidation in history never approached a critical tipping point. Here's what actually happened.
88% of forced crypto selling happened in 30 minutes—the cascade was over almost before it started
The Collapse Nobody Predicted (And Why It Looked Like a Chain Reaction But Wasn't)
On October 10th, 2025, the cryptocurrency market experienced its largest single-day liquidation event ever recorded. In the span of roughly twenty minutes, $644 million in leveraged positions were force-sold. The price of Bitcoin swung by thousands of dollars. On trading desks and in Discord servers filled with panicked traders, the word "cascade" circulated like a diagnosis: the market was caught in a self-reinforcing spiral, each liquidation triggering the next, amplifying into catastrophe.
The story felt intuitive. Leverage creates fragility. When prices move against heavily borrowed positions, automated systems liquidate them. Those sales move prices further against the remaining overleveraged traders, triggering more liquidations. A chain reaction builds. The market reaches a critical point where infinitesimal additional pressure produces infinite amplification. Predicting crashes becomes a matter of reading the warning signs of that approach—a system shedding resilience, fluctuations growing larger and more correlated, the market groaning toward its breaking point.
Except that isn't what happened.
A new paper by Ramon Marc Garcia Seuma, published on arXiv, studies seven major crypto-perpetual liquidation cascades between 2022 and 2025, including the October 2025 event. By combining on-chain data from the fully transparent exchange Hyperliquid with Binance trading records, the analysis traces the mechanics of these crashes with unusual precision. The findings are quietly radical: these cascades never approached a critical threshold. They weren't slow chain reactions building toward a tipping point. They were abrupt, front-loaded events where most of the destruction happened in minutes, and where the exchange's own mechanisms suppressed the very feedback loop that theory predicted.
"The branching ratio," Garcia Seuma writes, "is, in effect, engineered down at the climax."
Understanding why this matters requires unlearning the intuitive story of market crashes and rebuilding the account from the data up.
The Question Nobody Had Actually Answered
The idea that markets might undergo "critical transitions" has circulated in finance and complexity science for decades. The intuition is borrowed from physics: systems near a critical point exhibit distinctive signatures. Fluctuations grow larger and more correlated. The dominant pattern of behavior—think of the way all assets start moving together in a crisis—becomes increasingly pronounced. Recovery from perturbations slows. Early warning signals, in principle, could alert observers that a system is approaching its tipping point.
Applied to markets, this suggests that crashes might not be random exogenous shocks but endogenous instabilities—the market gradually approaching its own edge, becoming increasingly fragile until an infinitesimal trigger tips it over. Didier Sornette and colleagues developed "log-periodic" models of this critical dynamics. The broader early-warning-signals literature, drawing from ecology and earth science, proposed operational markers: rising autocorrelation, increasing variance, slowing recovery. The research program was ambitious. If crashes were critical transitions, they might be predictable. Resilience might be measurable. Warning signs might be detectable in the data before the collapse.
Garcia Seuma's Part I paper, published earlier, put those operational claims to the test across the same seven crypto cascades. The results were negative: no single-variable early-warning signal was invariant across events. Critical slowing down—the signature of a system approaching its tipping point—was absent precisely where the shock was most abrupt.
But a negative result on warning signals poses a question it cannot answer: if these weren't critical transitions, what were they? The order of the transition—whether it's first-order (discontinuous, with a jump) or second-order (continuous, with a critical point)—has to be measured in the right place. And the right place isn't any single price series. It's the correlation fabric itself—the way assets move together or apart, the collective structure of the market.
This paper does exactly that. And in doing so, it settles a prior question that critical-transition advocates couldn't actually answer with their own framework.
Seven Crashes, One Transition
The data comes from three sources. The first is a panel of the most liquid Binance USDT-margined perpetuals—contracts that track the price of an asset but settle in a stablecoin—at five-minute resolution across seven event windows. The panel grew from 22 assets in May 2022 to 30 by 2024-2025, a composition change the paper controls for explicitly. The second is Binance's BTC series: one-minute price candles and five-minute derivatives data, which underpins the impact measurements. The third is Hyperliquid, a fully on-chain exchange where every open position and every forced fill is publicly visible. This last source is decisive. On most exchanges, the mechanics of liquidation are opaque. On Hyperliquid, they're transparent by design.
The seven events are listed in a table in the paper, each with an onset time—defined mechanically as the minute that terminates the most negative 60-minute log return within a window around the documented crash date. The onset is found algorithmically, not hand-picked, which matters for the integrity of the analysis. May 2022 (triggered by the LUNA/UST collapse), November 2022 (FTX's insolvency), August 2024 (the yen carry-trade unwind), December 2024 (a leverage flush), February 2025 (a tariff announcement), April 2025 ("Liberation Day" tariffs), and October 2025 (the record liquidation cascade). Five are classified as "endo" (endogenous), meaning the prior paper found no critical slowing down in price autocorrelation; two as "exo" (exogenous), meaning the shock was abrupt and external. The paper is careful to note that this typing is empirical, not causal—a useful grouping inherited from the prior analysis, not a validated taxonomy. No claim in the paper depends on it.
The key insight is that the transition must be measured in the cross-asset correlation structure, not in any single price series. The "order parameter" is the mean pairwise coupling between assets—essentially, how much they move together. A high value means the market is in a coordinated phase, all assets moving in lockstep. The "susceptibility proxy" is the extensive variance of those couplings—essentially, how much disagreement or spread exists in how assets move. At a genuine critical point, this quantity would diverge, growing without bound as the system approaches its tipping point.
What the paper finds is that at onset, the order parameter jumps. Across six of the seven events, the mean coupling rises by between 1.6 and 4.4 baseline standard deviations in a single step, into a near-fully-ordered phase where assets move almost uniformly together. The mean coupling reaches roughly 0.85 to 0.90, and the leading eigenvalue—which captures how much of the market's variance is explained by a single dominant factor—absorbs about 90% of total variance. This is not a gradual approach. It's a discontinuous jump.
The susceptibility proxy does the opposite of what criticality requires. Instead of diverging, it collapses—a negative jump in five of seven events, reaching as low as -3.4 standard deviations. It diverges in none. In the October 2025 event, the minimum spanning tree, a tool for visualizing correlation structure, contracts from a normalized length of 0.60 to 0.24 in a single step.
The decisive control is finite size. A discontinuous jump could in principle be an artifact of a small, growing panel—a crossover effect that vanishes in larger samples. The paper therefore runs a subsampling analysis, varying the panel size from N=8 to N=28 assets, and repeating the measurement 40 times at each size. The result: the onset jump is invariant. It holds at 3.1 to 3.3 standard deviations for the April event, 5.5 to 5.65 for December, 2.26 to 2.33 for November, and so on across all events. The susceptibility remains extensive at every panel size. No critical scaling appears. A scale-invariant jump with a collapsing, extensive susceptibility is the signature of a first-order transition—not a critical point.
Figure 1: The fabric transition across all seven events. The order parameter (top row, c̄) jumps into the near-fully-ordered phase at onset in six of seven cases, while the susceptibility proxy χ (bottom row) collapses rather than diverges. May 2022, already ordered, is the exception. Source: EXP-012.
This is a finding about the structure of these events, not about any single series. February 2025, which showed no single-variable early-warning signal in the prior paper, shows the strongest fabric build-up—a pre-onset Kendall rank correlation of +0.83, the only pre-onset trend that survives block resampling on both fabric metrics. October 2025 is the opposite outlier: it de-correlates into onset, with the susceptibility jumping positively rather than collapsing, even as it is the most violent event by every liquidity measure. The order of the transition is not readable from any one series. This is why single-variable early-warning signals failed in Part I—and it's why you have to look at the correlation fabric to understand why.
Where the Signature Lives
If the transition is first-order—abrupt, with no approach to a critical point—then where does the universal crash signature appear? The paper's answer is precise: the liquidity sector.
On Binance, a Kyle-style impact regression—essentially, measuring how much the price moves in response to a given volume of aggressive selling—gives a coefficient k that spikes during every one of the seven cascades. The six-hour mean impact is elevated by a factor of 1.2 to 3.5 times baseline, with only a modest pre-onset build. On Hyperliquid, the same quantity is available directly from quoted impact prices, with no regression required. The cascade impact-spread spikes for all six major instruments, by a factor of 3.2 to 9.1 in the mean, and 51 to 9,271 at the cascade-day maximum.
Open interest—the total value of outstanding derivative contracts—clears hard. It falls to 0.30 to 0.55 of baseline on Hyperliquid, representing a 45% to 70% reduction. On Binance BTC, it falls 24.6%. That two venues, two margining conventions, and two independent measurements agree that impact spikes in every cascade—where regressed and where quoted directly—is the universal fact any mechanism must reproduce.

Figure 2: The in-cascade liquidity signature appears on two venues and two instruments. Top: Hyperliquid BTC through the October 2025 cascade—open interest, quoted impact spread, and perp premium around onset. Bottom: the regressed Binance Kyle impact k(t) for all seven events, normalized by baseline. The impact spike and the deep OI clearing are universal. Sources: EXP-017a, EXP-017b.
This is consistent with the market-liquidity spiral mechanism documented by Brunnermeier and Pedersen (2009) and the order-book dry-up documented for Bitcoin by Donier and Bouchaud (2015). When prices move sharply, leveraged positions are liquidated, and those forced sales further deplete order book liquidity. Market makers widen spreads or withdraw entirely. The price impact of each subsequent sale becomes larger, even if the volume is the same. The spiral is not a chain reaction of forced liquidations triggering forced liquidations in a branching cascade. It's a withdrawal of the infrastructure that makes orderly trading possible.
What the Branching Model Predicted (And Why It Failed)
The natural mechanistic account for a liquidation cascade is a Galton-Watson branching process. The logic runs: forced selling of notional V moves the price; the relative price move sweeps over the liquidation-threshold density, triggering further forced sales; each forced sale, on average, triggers some number of further forced sales. If that number—the branching ratio λ—is less than one, the cascade dies out. If it equals one, the cascade is critical: it neither grows nor shrinks on average, and small perturbations determine whether it fizzles or explodes. If it exceeds one, the cascade supercritical: it grows without bound, limited only by the finite supply of leverage.
The branching ratio can be written as λ = k × ρ̃, where k is the price impact per dollar of net aggressor flow (how much a dollar of selling moves the price, in relative terms) and ρ̃ is the forced notional per unit of relative price move (how many dollars of leveraged positions get liquidated by a given price move). Both factors are measurable. The model makes two falsifiable predictions, and both fail.
The first is a timing prediction: if the pre-onset rise in λ reflects a genuine approach to the critical boundary, it should stand out against declines of comparable depth that did not cascade. It does not. Against placebo onsets matched on trailing three-day returns, only four of seven events sit above the matched median—not significant by standard tests. And the effect is substantially mechanical: on placebos, λ tracks the trailing price path itself, with a correlation of -0.38 between pre-onset λ and the three-day return. The deeper the trailing decline, the higher λ reads. This is not a warning of approaching catastrophe; it's a byproduct of recent price movement.
The second prediction is more consequential: the model requires that realized amplification—how much larger the total cascade is than the initial shock—should scale as V₀/(1-λ), which in logs is proportional to -log(1-λ). If λ is approaching 1, this quantity should blow up. The paper tests this prediction in both price-conditioned and volume-native designs, with power simulations showing 95.8% and 97% ability to detect a true unit slope if one existed. The measured slopes are -0.244 and -0.152, centered on zero and including zero in their confidence intervals. The branching model is rejected. Severity is not predicted by pre-onset λ.
The reason is structural. The product k × ρ cancels itself. In the data, log k and log ρ are negatively correlated at -0.72. When impact per dollar rises (more liquid market), the density of liquidation thresholds falls (less leverage concentration), and vice versa. The incremental explanatory power of ρ over k is zero to four decimal places. The two factors that multiply to give λ are substitutes, not complements—and their substitute relationship is strong enough to destroy the model's predictive power.
The paper then upgrades to directly measured impact from Hyperliquid's quoted prices, replacing the Kyle regression estimates. The unit slope is rejected at every scale with power ≥ 0.99 under two designs. The rejection is not an artifact of measurement error in the proxy; the proxy was reliable (correlation +0.678), well above the attenuation boundary. One sign result that appeared in the proxied analysis—a negative loading of k in some specifications—vanishes on measured k (+0.638). It sat entirely on the Kyle-estimator component orthogonal to true impact. A lesson in the fragility of proxy-based inference.
The punchline is uniform across proxied and measured regressors: none of the scalar pre-state measures that can be constructed from public data grades severity. Not the stock of leverage. Not measured book fragility. Not their product. This is a statement about the quantities available from public pre-cascade data, not a proof that no such quantity exists—but it's a strong constraint on what the literature has proposed so far.
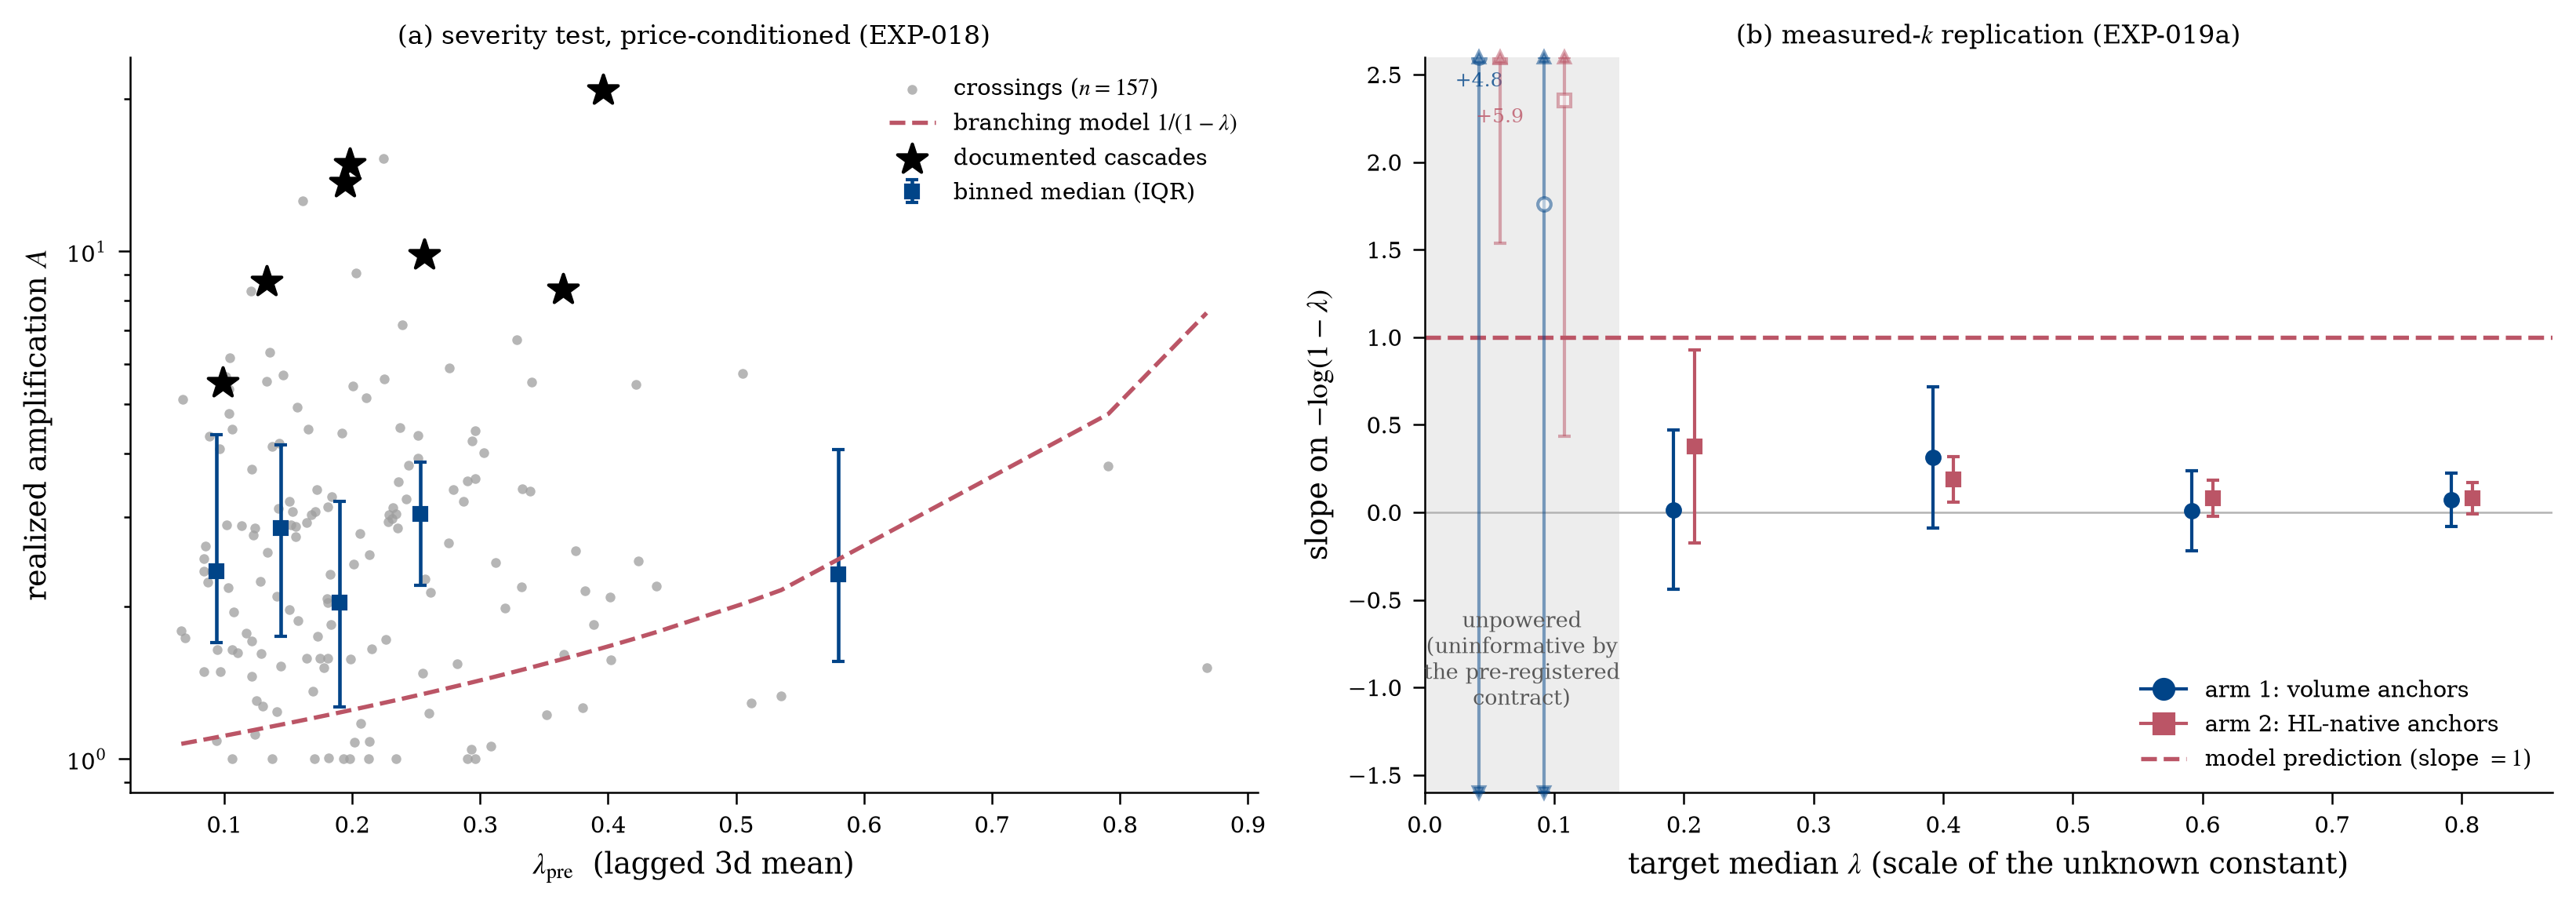
Figure 3: The severity test. Left: realized amplification against λpre, with the branching model's zero-parameter prediction (curve). The binned medians are flat where the model requires them to rise. Right: the same test with k measured from Hyperliquid quoted impact prices. Filled markers are powered at ≥0.99; open markers are uninformative. Sources: EXP-018, EXP-019a.
The Engine, Measured in Flight
The paper's most striking contribution is the direct measurement of the October 2025 cascade's branching ratio in flight, from Hyperliquid's on-chain fill log. This is possible because Hyperliquid publishes every forced fill, attributed to the liquidated user, in real time. The fill log begins on May 25, 2025, so the October 2025 cascade is necessarily the single case-study arm for this analysis—a limitation acknowledged in the paper.
Three complementary constructions agree, and they're not statistically independent (all three read the same event and the same fill log), but they rest on different assumptions. A shared artifact would have to survive all three.
The structural ratio λ_struct = k̂ × ρ̃, with both factors measured in the units of the branching equation and no free constants, traces from 0.031 in baseline conditions to 0.097 in the late pre-onset window, to 0.195 at nucleation, to 0.140 at peak, then back to 0.032 in the late cascade. Subcritical throughout. Deeply subcritical.
A flow-based estimator—an integer autoregressive or Hawkes process read of one-minute forced-sell counts—falls to 0.28 through nucleation rather than rising. (The calm-market level of this estimator sits near 0.56 from mechanical clustering, and it must be read as a trajectory, not a level. The paper cites Hardiman et al. (2013) and Kirchner (2017) on this point.)
And a direct amplification bookkeeping—nucleation-window forced notional of $644 million against a full-cascade total of $733 million over 15.7 hours—gives an amplification factor of 1.14 and an implied λ of 0.122. All three place the record cascade firmly below the critical boundary.
But the more revealing fact is structural. The cascade was not a slow chain reaction but an exogenous front-loaded sweep. Of all post-onset forced selling, 87.8% occurred in the first 30 minutes. 96.5% occurred within an hour. This is not a slow-building cascade; it's a rapid-fire sweep. Over the full October 9-11 window, the same liquidation population swept $0.96 billion across eighty price buckets spanning $100,700 to $122,700. The additional $225 million had been swept before onset. The two totals are the same fills under the same sign and deduplication conventions, differing only in the time window.
And crucially, most of the offspring never touched the order book.
The venue backstop—Hyperliquid's automated mechanism for clearing insolvent positions without routing them through the public order book—absorbed 62.6% of post-onset forced-sell notional off-book. In the worst minute (21:19 UTC), $641 million was force-sold, of which $576 million was absorbed by the backstop against only $64 million on the book. The branching ratio is, in effect, engineered down at the climax. This is an instance of what Tushar Chitra (2025) has called the automated-deleveraging trilemma: venues face a tradeoff between absorbing losses themselves, passing them to liquidators, and maintaining market stability.

Figure 4: The October 2025 engine in flight. Top to bottom: BTC mid price; measured forced sells per minute, split into the market leg (that hits the book) and the backstop leg (absorbed off-book); and the two branching-ratio estimates against the critical boundary λ=1. Right: the realized liquidation map over the full window—$0.96B of book-hitting forced sales across eighty 0.25%-wide price buckets. Source: EXP-019b.
October 2025 branching ratio by regime
The structural branching ratio λ_struct peaks at 0.195 during nucleation—still deeply subcritical, nowhere near the critical boundary of λ=1.
| Label | Value |
|---|---|
| baseline | 0.031 |
| pre-onset | 0.097 |
| nucleation | 0.195 |
| peak | 0.14 |
| late cascade | 0.032 |
Regime-by-regime decomposition of the October 2025 branching ratio. The structural ratio (λ_struct) peaks at 0.195 during nucleation—still deeply subcritical. The flow-based estimate (λ_flow) falls through the cascade. Source: EXP-019b.
This yields a concrete, falsifiable design prediction: venues without such a backstop vault should run a hotter realized λ. The amplification that would otherwise appear as cascade growth gets absorbed by the venue's own capital. The feedback loop that branching theory predicts is suppressed by the mechanism designed to manage it.
Why This Changes Things
The implications of this analysis extend beyond cryptocurrency markets, though the transparency of on-chain venues makes them the clearest laboratory.
First, and most fundamentally: these cascades were not critical transitions. The search for early-warning signals was not a failed application of a correct theory. It was a search for a pattern that wasn't there. The transition is first-order in its signatures—discontinuous, with a jump rather than an approach. The order parameter jumps. The susceptibility collapses rather than diverging. This is not a marginal or regime-dependent finding; it's repeated across seven events and stable under subsampling.
This matters for the broader program of identifying fragile pre-states. If markets were approaching critical points before crashes, there might be observable signatures—a system shedding resilience, approaching its edge. The entire early-warning-signals literature rested on this premise. If the transitions are first-order, the pre-state looks different. There may be no gradual approach to measure. The system might be relatively stable until it isn't, with the crash as an abrupt regime shift rather than a tipping point.
Second: severity is not predicted by pre-state measures. The branching model's zero-parameter prediction fails. The structural substitute relationship between impact per dollar and liquidation density destroys the model's predictive power. No scalar pre-state measure—leverage stock, book fragility, their product—grades severity. This is a strong negative result in a literature that has proposed many candidate predictors.
The paper is careful about the scope of this claim. It doesn't prove that no predictor exists, only that none exists in the quantities constructible from public pre-cascade data. The candidate that the paper is structurally unable to test is named in the synthesis: the map-in-path, the specific geometry of leveraged positions relative to the price path, may matter more than aggregate metrics. Two events with identical leverage stocks could have vastly different outcomes depending on where prices go.
Severity test: slope on -log(1-λ) by design
The branching model requires a slope of 1.0 on -log(1-λ). All measured slopes are centered near zero, with confidence intervals that include zero. The model's prediction is rejected at power ≥0.95.
| Label | Value |
|---|---|
| Price-conditioned (Kyle) | -0.244 slope |
| Volume-native (Kyle) | -0.152 slope |
| Volume anchors (HL) | 0.015 slope |
| HL-native anchors | 0.376 slope |
Severity vs. pre-onset branching ratio. The branching model predicts amplification proportional to 1/(1-λ)—a curve that blows up as λ approaches 1. The data are flat. Neither the proxied Kyle regression (left) nor directly measured impact from Hyperliquid (right) shows the predicted relationship. Sources: EXP-018, EXP-019a.
Third: the mechanism is front-loaded, not chain-reaction. The branching ratio never approaches the critical threshold. The cascade is a sweep, not a slow build. Most forced selling happens in minutes. Most of it is absorbed off-book by the venue's backstop. The feedback loop that branching theory predicts is suppressed by the mechanism designed to manage it.
This reframes the architecture of risk. A cascade is not a system approaching its edge; it's a shock encountering a specific configuration of leverage, liquidity, and exchange mechanisms. Severity is set by the size of the initial shock, the map-in-path (which determines how many positions are affected by a given price move), and the withdrawal of liquidity—multiplied together, not by a diverging multiplier.
What Remains Open
The paper has limits, and it names them. The branching ratio measurement is necessarily a single case study; the fill log begins in late May 2025, so a severity test across historical events is structurally impossible. The panel of seven events is heterogeneous, and the two exceptions (May 2022, already ordered, and October 2025, where χ does not collapse) are named throughout. The typing of events as endogenous vs. exogenous is empirical, inherited from the prior paper, not a validated causal taxonomy. The paper doesn't claim to prove that criticality is absent from leveraged markets in general—only that it is absent from this proxy over these windows.
Several questions remain open. The "map-in-path" is invoked as a determinant of severity, but it's not directly measured. Two events with identical pre-state aggregates could produce different outcomes if prices trace different paths through the liquidation clusters. The paper acknowledges that its designs are structurally unable to test this candidate predictor. The backstop mechanism on Hyperliquid suppresses the branching ratio at the climax—but what happens on venues without such a backstop? The falsifiable prediction is clear: they should run a hotter realized λ. Whether that prediction holds awaits cross-venue data that doesn't yet exist in comparable transparency.
There's also the question of what the fabric transition actually causes. The paper characterizes the order of the transition and locates the in-cascade signature in the liquidity sector, but it doesn't resolve the causal direction. Does the correlation fabric cause the cascade, or does the cascade cause the correlation fabric to crystallize? The October 2025 event de-correlates into onset, which suggests the order parameter jump is a consequence rather than a cause—or at least that the causal story is more complex than a simple first-mover.
And there's the question of generalizability. Crypto perpetual futures are a specific market with specific features: high leverage, rapid iteration of exchange mechanisms, transparent on-chain data. The findings about branching ratios and backstop mechanisms may be specific to this context. But the broader insight—that cascades are first-order transitions, not critical points—may be more portable. The market-liquidity spiral mechanism, the order-book dry-up, the substitute relationship between impact and leverage density—these are not uniquely crypto phenomena.
The Shape of What Comes Next
The paper closes with a synthesis that is worth quoting at length:
"Severity is set by shock × map-in-path × liquidity withdrawal rather than by a diverging multiplier, which is why none of the scalar pre-state measures we can construct grades it."
This sentence contains the paper's most important implication for the broader project of understanding market crashes. The failure of early-warning signals is not a failure of measurement. It's a consequence of the structure of what early-warning signals were trying to measure. If the pre-state doesn't contain a diverging quantity—if severity isn't a function of how close the system is to some critical threshold—then no scalar measure of the pre-state can predict it. The cascade isn't a system approaching its edge. It's a shock meeting a specific landscape of leverage and liquidity.
This reframes the questions that follow. Rather than asking "how close was the market to a critical point?" the relevant questions become: what determines the map-in-path? How do initial shocks get translated into liquidation cascades? What is the geometry of leveraged positions relative to price trajectories, and can it be measured or inferred? How do exchange mechanisms—the backstop, the liquidation engine, the funding arrangements—modify the realized cascade dynamics?
The backstop result points toward the most concrete next step. Hyperliquid's automated deleveraging absorbs 62.6% of forced-sell notional off-book. Venues without such a mechanism should run a hotter realized branching ratio. If the prediction holds—if decentralized exchanges with different mechanism designs show systematically different cascade dynamics—that would be strong evidence that the backstop is not just a correlate of subcritical cascades but a cause.
It would also be a rare thing in financial economics: a mechanism-design result with a falsifiable cross-venue prediction. Most theories of market microstructure are tested with correlation structures and regression coefficients. This one can be tested with the behavior of actual exchanges under actual stress.
The story of the October 2025 cascade is not, ultimately, a story of a market approaching its edge. It's a story of a shock meeting a landscape of leverage, liquidity withdrawal, and exchange mechanisms. The chain reaction that felt so intuitive—the sense that each liquidation was triggering the next, amplifying toward catastrophe—wasn't what the data showed. The cascade was over almost before it started. The feedback loop that branching theory predicted was suppressed by the architecture designed to prevent it.
What looked like a crescendo was a flash. And the reason it flashed rather than built is that the market's own defenses kept the branching ratio down—when the mechanism was there to do it.
Severity is set by shock × map-in-path × liquidity withdrawal rather than by a diverging multiplier.
Sign in to join the conversation.
Comments (0)
No comments yet. Be the first to share your thoughts.