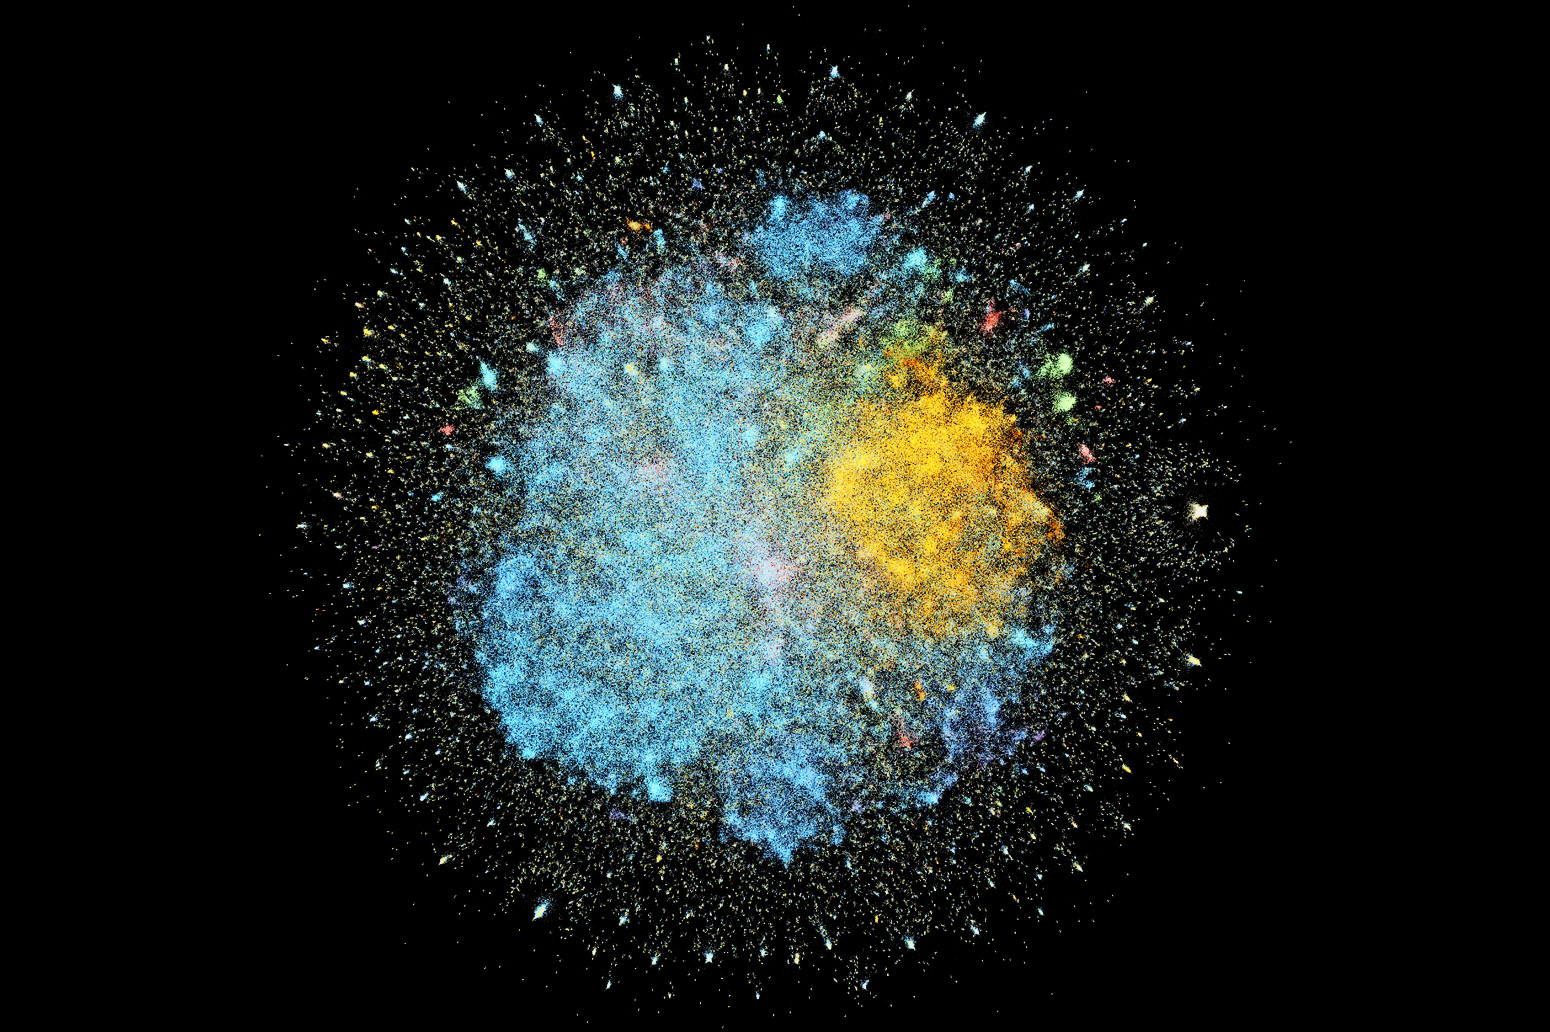
If you could see the entire body of climate knowledge as a night sky, it would shimmer with 1.8 million stars—each one a scientific study, glowing with the weight of evidence. This is the vision behind Carbon Brief’s Cosmos database, a luminous map of human understanding on climate change, where academic papers cluster like galaxies bound by invisible threads of citation. At first glance, the visualization resembles a celestial expanse: blue nebulae of physical sciences swirl beside golden clouds of social sciences, while a dense green galaxy pulses with medical research linked to climate impacts. Zoom in, and patterns emerge—tight constellations of tropical disease studies, one rooted in epidemiology, another in immunology, each orbiting the same crisis from different disciplinary angles.
This isn’t just art—it’s data made visible. The Cosmos database uses a technique called uniform manifold approximation and projection (UMAP) to compress a web of roughly 40 million citation relationships into a two-dimensional network graph. Papers are drawn together not by geography or publication date, but by intellectual gravity: if Study A cites Study B, or both are cited by others, they pull toward each other. The result is a map where proximity equals relevance, revealing how climate science weaves through medicine, economics, engineering, and beyond. At the heart of the blue physical sciences cluster, for instance, sits the Stern Review—a 700-page landmark report from 2006 authored by economist Nicholas Stern. Commissioned by the UK government, it remains the most-cited publication across all Intergovernmental Panel on Climate Change (IPCC) reports, a testament to its enduring influence.
The larger, brighter stars in the map belong to the "Cosmos 500," Carbon Brief’s ranking of the most-cited climate studies. Clicking on one reveals its metadata—authors, citations, field of study—like reading a star’s biography. But the real power lies in the spaces between. Papers floating at the edges of clusters, or in the voids between them, are often the most innovative: interdisciplinary works that bridge gaps, challenge silos, and spark new lines of inquiry. These are the studies that don’t just add to knowledge—they reconfigure it.
For educators, researchers, and anyone seeking to understand the architecture of climate science, the Cosmos database is a revelation. It shows not just what we know, but how we know it—how ideas build on one another, how disciplines converge, and where new connections might form. In an era of information overload, it turns fragmentation into coherence. And as climate challenges grow more complex, the map suggests a path forward: not by working in isolation, but by navigating the constellation of knowledge—together.